Department by the Numbers
Divisions
![1divisions.90a7032de353](https://domannualreports.stanford.edu/wp-content/uploads/2024/01/1divisions.90a7032de353.png)
![2faculty.23b46afc23a7](https://domannualreports.stanford.edu/wp-content/uploads/2024/01/2faculty.23b46afc23a7.png)
Faculty
91 University Tenure and
Non-tenure
128 University Medical Line
424 Clinician Educators
43 Instructors
16 Emeritus -Active
Endowed Professors
![3endowed.bf23102281f8](https://domannualreports.stanford.edu/wp-content/uploads/2024/01/3endowed.bf23102281f8.png)
![4staff.c58ec4b3d25f](https://domannualreports.stanford.edu/wp-content/uploads/2024/01/4staff.c58ec4b3d25f.png)
Staff & Research Associates
644 Reg Staff
97 Research Associates
151 Contingent Staff
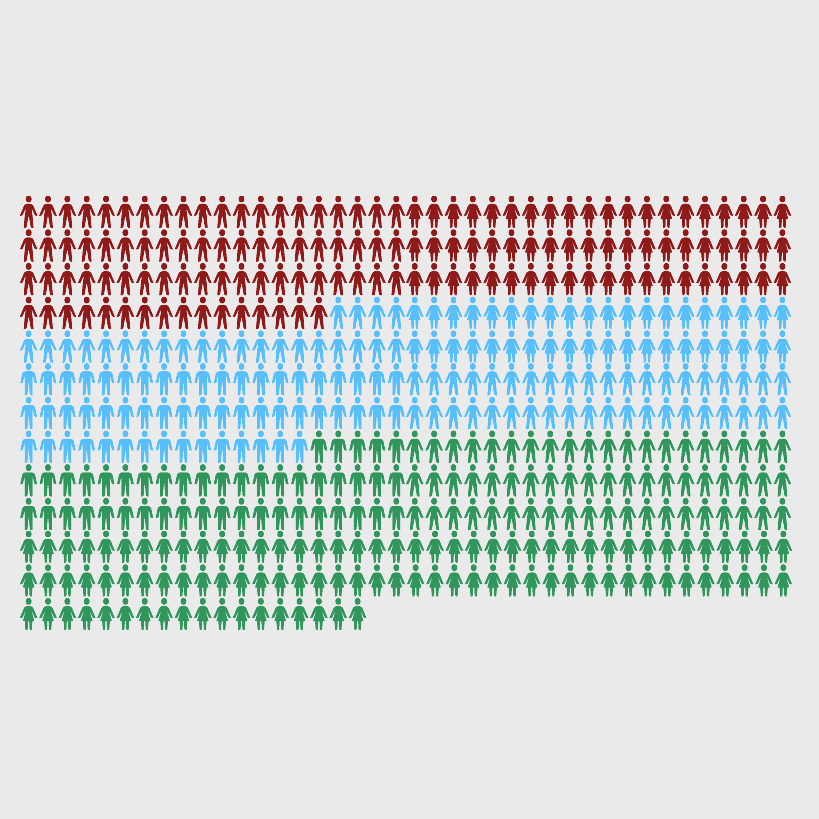
Trainees
136 Residents
159 MD Fellows
228 Post-Docs
![5trainees.99adb7c193f2](https://domannualreports.stanford.edu/wp-content/uploads/2024/01/5trainees.99adb7c193f2.png)
![6sponsored.5c5aae23f82f](https://domannualreports.stanford.edu/wp-content/uploads/2024/01/6sponsored.5c5aae23f82f.png)
Sponsored Research (Expenditures)
FY 22 as of 8/31
$91M NIH
$7M Fed Grants
$36M Non-Federal
$30M Industry Clinical Trials
New Awards
101 NIH
9 Other Federal
119 Non-Federal
106 Industry Clinical Trials
![7awards.bc1d492cac26](https://domannualreports.stanford.edu/wp-content/uploads/2024/01/7awards.bc1d492cac26.png)
Faculty 2022
2021
2020
2019
- 2019 – $127.7M
- 2020 – $135M
- 2021 – $144M